Currency Charts
Charts display
Chart parameters
Chart scaling
Open positions, deals and orders display
Orders in edit
Trade execution
Order management
The charts reflect the rate changes as well as your open position and orders for a selected instrument. There is also an option to execute trades and manage your orders: create, modify or cancel them.
You can choose between two variants of the chart: Basic or Advanced. The advanced one is available in the modern web browsers only. The basic one functions in all configurations supported by TradeRoom, however it offers the basic features only.
Both modes of the charts are in sync by their main parameters, i.e. when you switch between them, the selected instrument, period and, if possible, chart type, are kept.
The following additional features are available to you when using the advanced chart:
- Over 70 technical analysis indicators.
- Over 50 intelligent drawing tools.
- Multiple symbols on the chart, symbol comparison.
- Advanced price scaling.
- Save and load all chart settings and graphical objects.
- And much more.
The advanced chart is provided by the TradingView company; the complete chart documentation can be found on the developer's web site.
Charts information display
For clarity, the rate changes over a period of time are combined and displayed on the chart as a bar. The rate at the beginning of the duration (the rate at opening, Open), the rate at the end of the duration (the rate at closing, Close), as well as the maximum (High) and minimum (Low) rates are stored for each bar.
Each group is represented on the chart as a candlestick, or as a vertical line with notches called a bar. The candlesticks and the bars have different widths, so the way of the representation also affects the duration shown on the chart.
A candlestick depicts the rate changes as a rectangle with the lines going up and down resembling a candle stick.
The upper and lower sides of the rectangle correspond to the opening and closing rates of the period. The candlestick is drawn in red if the closing rate is less than the opening one (the rate has decreased). If the rate has increased, the candlestick is blue.
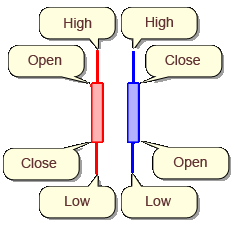
The lines going out of the rectangle illustrate the minimum and maximum rates for the period. The upper line corresponds to the bar maximum rate, while the bottom line is for the minimum one.
Bars depict the rate changes as a vertical line between the minimum and maximum rates. The bar is drawn in red if the closing rate is less than the opening one (the rate has decreased). If the rate has increased, the bar is blue. Depending on the type of the bar, there can be tick marks showing the opening and closing rates of the period.
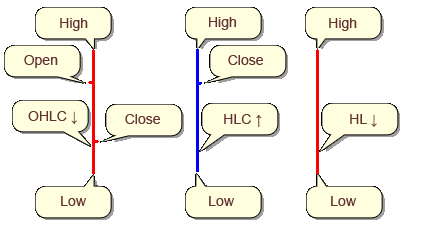
OHLC bar (Open, High, Low, Close) has the notches for both the opening rate (on the left) and the closing rate (on the right).
HLC bar (High, Low, Close) has a notch for a closing rate (on the right).
HL bar (High, Low) is a line with no notches which displays only the maximum and minimum rates.
The rate changes can be also depicted as a line. The line joins the period closing rates. When displayed as a line, the chart covers the longest period of time.
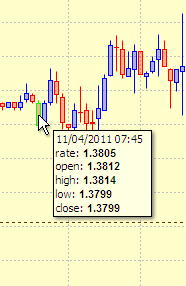
When you place the mouse pointer over a bar, a tooltip with the detailed information about the bar is displayed. It includes the bar time, the rate at the mouse location, and the values of Open, High, Low, Close.
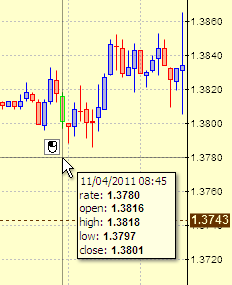
You can get displayed such a tooltip in an arbitrary point of the chart. The crosshair mode must be activated to do this. Press and hold the left mouse button in the point you need. A crosshair of the lines coming up to the coordinate axes will appear in the selected point. You will see a hint with the rate corresponding to the selected point, and the data of the bar the vertical line comes through. You can move your mouse to select the other points.
Chart parameters
The chart controls are above the chart. They allow selecting the information to be displayed, and the way it is represented. There is also a toolbar with additional preferences here.
Basic chart / Advanced chart is the current chart mode. You can click on this caption to call out the context menu which allows you to change the chart mode or to change some chart preferences.
Instrument is the instrument the chart will be displayed for. The default list contains only the instruments you have selected in the preferences. If you need to view the charts for the other instruments, mark the Enable all instruments for the charts option in the Trading preferences.
Period is the duration a single bar corresponds to. The available periods are 1, 5, 10, 15, 30, 60, 120, 240 and 480 minutes, day, week and month. The selection of a period allows to adjust the chart detail and the covered duration. The shorter the period, the more detailed the chart is, but the shorter the duration the chart covers. You can select a longer period of the rate grouping to increase the duration the chart to cover.
Type selects the display of each data group: as a candlestick, a bar, or a line. Candlesticks and bars have different widths, so the amount of them the chart can hold depends on the display method. The largest amount of the data goes into the chart when represented as a line. The HL bars are the most compact of the bars. The least data is held when displayed as the candlesticks. You can compress or decompress the chart horizontally when selecting the form of the chart.
Rate allows selecting the Bid or the Ask rate to be displayed on the chart. This can be useful, for example, when checking the order execution. If the order is to be executed at the Ask rate, then it is more convenient to see the Ask rate on the chart.
The toolbar below the chart contains the additional buttons:
 activates the crosshair mouse mode. This mode allows viewing the
rate information in the arbitrary point of the chart.
The button is highlighted when the crosshair mode is active.
activates the crosshair mouse mode. This mode allows viewing the
rate information in the arbitrary point of the chart.
The button is highlighted when the crosshair mode is active.
activates the
scrolling mouse mode. You can scroll the chart to select the visible area in this
mode. This button is highlighted when the scroll mode is active.
enables or
disables the automatic scaling of the chart. The button is highlighted when
the auto-scaling is enabled.
displays the
chart preferences window.
displays the Chart help page.
Chart scaling and mouse mode
The chart is scaled by default automatically, so that the bars occupy maximum chart space but don't get clipped. You can change the scale to see the open positions or the orders which do not get into the chart. To do this, press and hold the left mouse button on the right of the rate axis, and then move the mouse up or down. The mouse pointer will change to reflect possible movement directions. The scale changes as if you were dragging the grid line: it zooms in when you move the mouse pointer up, and zooms out when you move it down.
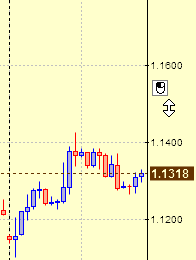
The automatic scaling is disabled when you change the scale. Use the
toolbar button to re-enable it.
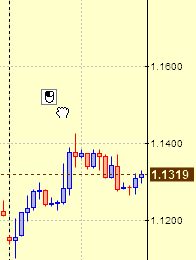
When you change the scale, the mouse is automatically switched from the crosshair mode
when you can view a tooltip to an arbitrary point of the chart,
to the scroll mode which allows selecting the visible area of the chart. You can press and
hold the left mouse button on the chart, and then scroll the chart with the mouse in this
mode. Press the
toolbar button to go back to the crosshair mode.
Open positions, deals and orders display
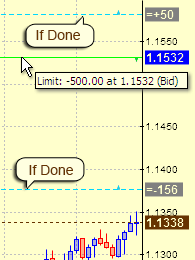
The open positions, deals and orders are represented in color horizontal lines. The open position and deal lines are green; the open position line is thicked. The color of the order line corresponds to the order type: Stop orders are displayed in red, Limit orders are blue, and the orders with Auto type are grey. The active orders are represented in a solid line, while the If Done order lines are dashed. If the order rate is specified as an increment, its line is positioned relative to the line of the parent order.
Note: the deals can be displayed on the chart only if the display of the deals in the open positions table is enabled in the Trading Preferences.
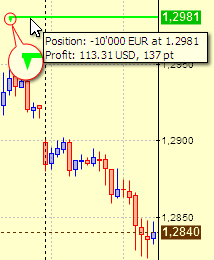
The order lines and that of the open position start opposite to the date of their last change; the deal line starts opposite to the date of its execution. There is a triangle mark at the beginning of the line indicating the direction of the trade. It points up for a positive amount of the base currency (long position, buy) or down for a negative one (short position, sell). The rate of the open position, of the deal or that of the order is indicated at the right edge of the line, on the rate axis.
Note: the lines can occupy the full chart width. The Extend lines to left option of the chart preferences must be enabled for this. However, you should consider only the part of the line on the right of the last change date when analyzing the event. That is why the line on the left of the change date is semitransparent. The If Done orders are not executed until they become active, so their lines are dashed and monochromatic.
![]()
If the rate of the order, of the deal or of the open position lies beyond the chart scale, there is an arrow near the edge of the chart beyond which the line is. It is placed opposite the date of the last change of the order or the open position and points in the direction of the trade. When you place the mouse pointer over the indicator of the open position, the deal or the order, it is highlighted, and a tooltip with the additional information is displayed. The additional information for the open position or the deal is the amount, average rate and profit in points; while for the order it is the order type and the trade parameters. If several arrows at the chart edge overlap, a multicolor or a double-headed arrow reflecting the line types and trade directions can be displayed, and the tooltip contains the list of the objects.
When you place the mouse pointer over the order with linked orders, they are also highlighted: for an If Done order only the parent order is highlighted; while for an active order all linked If Done orders are highlighted.
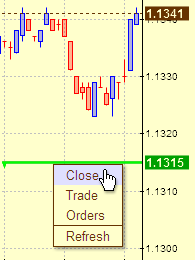
The lines of the objects not only indicate the object position, but also allow performing operations with the objects. A context menu with available actions is displayed when you click a line. You can make a new deal for the current instrument, close a position or a deal, place or modify the orders linked to it, from the open position or the deal menu. You can cancel the order, edit it or place a new one from the order menu.
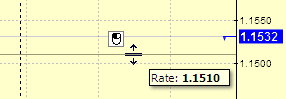
You can also quickly change the rate of the order by dragging its line with the mouse.
You can configure the display of the open positions and orders. The chart preferences include separate options for the display of the open positions, active orders, and If Done orders.
Orders in edit
The orders open for editing can be also displayed on the chart. This simplifies the order rate selection and correction.
When you switch to the editing of the existing order, or placing a new one, the lines corresponding to this order and to the linked If Done orders, if available, appear on the chart. If the If Done order rate is specified as an increment, its position is calculated relative to the line of the parent order. The line of the order being edited occupies the full width of the chart and does not have any marks.
When you edit the rate in the order editing form, the line position is changed respectively. You can also drag the order editing line with the mouse, and the rate in the order editing form will change. Please note that dragging the order editing line affects only the rate in the editing form, and the change comes in force only when you save the order.
The display of the orders in edit can be disabled in the chart preferences.
Trade execution
There are buttons to quickly switch to the trade execution in the Charts tab.
Trade is meant to execute a trade on the selected instrument, and displays quotes for the trade.
Close position is meant to close the open position for the selected instrument. It is similar to the Trade button, but the trade amount and direction are automatically selected to close the position. This button is available when you have an open position for the selected instrument.
You can also switch to the trade execution with the context menu which is called out with a mouse click in the empty area of the chart as well as on the deal or the open position line. In the latter case, the menu will contain a command to close the position, or the deal.
You can view charts for other instruments when the quotes for the trade execution are displayed. This does not affect the instrument selected for the trade execution. To change it, select the desired instrument in the chart and click on Trade or on Close position again.
Order management
You can manage your orders for the selected instrument on the Charts tab: place, modify, or cancel.
Click anywhere on the chart, except for the bars, to place a new order. A pop-up menu will be displayed. Select the new order placement menu item, and the order editing form will be displayed below the chart. The order rate will be pre-filled according to the point of the chart you have called out the menu for.
The pop-up menu contains the commands to edit the order and to cancel it if you click on the existing order. The editing form is displayed below the chart too. You can view the charts for other instruments or switch to other tabs of the Trading page during the editing.

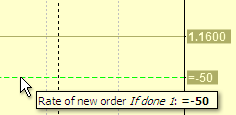
If you need to change only the order rate, it is enough to drag the order mark right on the chart. The tooltips with the value of the new rate will be displayed as you drag. The rate will be saved when you release the mouse button.
Please note how the linked If Done orders with their rate specified as an increment move when you are dragging the parent order.